
39
It concerns the TimeSpy test
The developers of the 3DMark benchmark have published a graph showing the growth of video card performance in the TimeSpy test over the past eight years.
This period of time included four generations of AMD and Nvidia video cards from GTX 10 to RTX 40 and RX 7000.
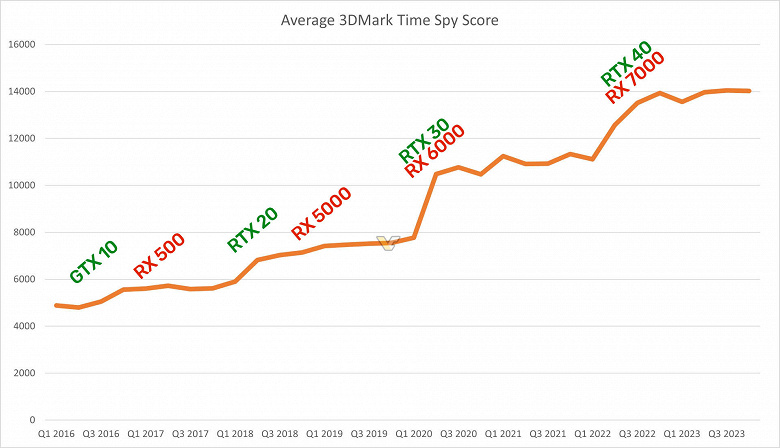
The graph clearly shows that at the time of the release of the RTX 30/RTX 40 and RX 6000/RX 7000 lines, the two most pronounced performance jumps took place. Moreover, they were approximately the same in absolute terms, although in percentage terms in the first case the growth was stronger.
By the way, the graph was built on the basis of 48 million test results, and for the entire period the productivity growth was slightly less than threefold.